


Review of Causal Discovery Methods Based on Graphical Models
F for full screen, esc to exit
Intro
A fundamental task in various disciplines of science, including biology, is to find underlying causal relations and make use of them. Causal relations can be seen if interventions are properly applied; however, in many cases they are difficult or even impossible to conduct.
A traditional way to discover causal relations is to use interventions or randomized experiments, which is in many cases too expensive, too time-consuming, or even impossible.
Therefore,revealing causal information by analyzing purely observational data, known as causal discovery,has drawn much attention.
DGCM
Directed Graphical Causal Models 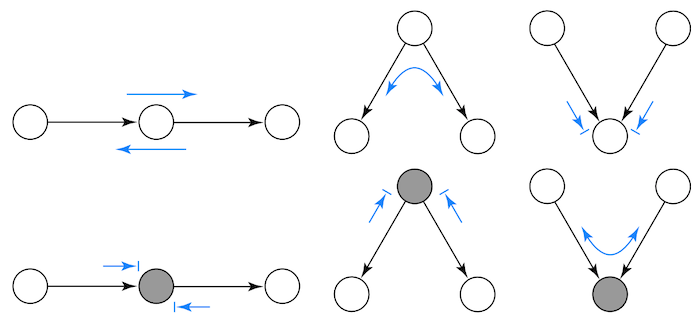
Chain Structure
Dependence flows in the direction of the arrows. The greater the causal expertise, the greater your chances of getting a promotion. 
As a general rule, the dependence flow in the direct path from A to C is blocked when we condition on an intermediary variable B.
Fork Structure
As a general rule, two variables that share a common cause are dependent, but independent when we condition on the common cause. 
Collider structure
As a general rule, conditioning on a collider opens the dependence path. Not conditioning on it leaves it closed. 
Methods
Some methods using to build CAUSAL MODELS.
The PC Algorithm
- Form a complete undirected graph
- Eliminate edges between variables that are unconditionally independent
- For each pair of variables (A, B) having an edge between them,and for each variable C with an edge connected to either of them, eliminate the edge between A and B if
- Keep on more pair
The FCI Algorithm
- FCI orients edges by a procedure similar to PC but without assuming that every edge is directed one way or the other.
- Have a 'o' mark,means can be an arrow head or an arrow tail.
- Bidirected edge between Y and Z indicates that there is at least one unmeasured confounder between Y and Z.